
Jira Connector for Google Data Studio
Jira for Google Data Studio is a community connector for Google’s Data Studio product. It allows you to pull statistics like story lead time into Data Studio and generate reports that help your team gather insights into potential process changes that may improve delivery.
How does it work?
Data Studio is a free product offered by Google that allows you to build reports using a plethora of data sources. With this connector you will be able to add a data source that targets your Jira instance. The connector code runs as a Google Apps Script (similar to Google Sheets scripts) in the context of your Google account. This connector code makes requests to my proprietary API which pulls data from Jira and crunches the statistics.
Usage
The connector is not currently public; eventually my goal is to submit it to Google so that it will appear in the Data Studio Connector Gallery but in the meantime access must be requested from me directly. If you need assistance getting it set up, please contact me.
Setting it up
Once you have been granted access to the connector itself, you will need to add it as a data source to your report.
You will be prompted for your Jira credentials - for this you will need your Jira token. To issue a new access token for your user go to your Jira account settings, then go to Security > API Token > Create and manage API tokens and create a new token. The token will be copy/pasted to the token field in Data Studio and your username will be your Jira e-mail prefixed with the instance ID and a forward slash. This is required because each Jira instance runs on its own subdomain and without knowing which domain is associated with your username it will be impossible to connect to the API. So, for example if you access Jira via https://mycompany.atlassian.net/ and if your Jira e-mail is janesmith@zzz.com then your username for the purposes of the Data Studio connector will be mycompany/janesmith@zzz.com.
Once authentication has succeeded, you will be prompted to enter a JQL query and select the type of report you’re interested in. The JQL query is essentially the filter for which issues you want to calculate statistics for. At its simplest, this could be project = XYZ but you can play with the “issues” view in Jira to create more customized filters to match your needs. For example, you may want to ignore sub-tasks and epics (project = XYZ AND issuetype != Sub-task AND type not in ("Epic")). For more info regarding JQL check out Atlassian’s documentation on the subject.
For the “report type” select whichever one you are interested in. If you want both, which is likely, you’ll simply need to add a second data source using the same JQL query but the opposite report type.
What’s the difference between the “Issue” and “Daily” report types?
In Data Studio there is a concept of “dimensions” (ways to categorize data points) and “metrics” (which are statistics that can be applied in aggregate to groups of data points). For values like lead time (a metric) the corresponding smallest dimension is the issue key (e.g. XYZ-123). However, for values like the number of issues in WIP or the cumulative finished issues there is no corresponding issue key - the smallest dimension (really pair of dimensions) for that value is the day which you are looking at and the issue type. For this reason, calculating WIP/finished issues/throughput is impossible to do without also separating the concept of lead times.
How are lead times calculated?
Lead times are calculated as the number of seconds since the time the issue first transitioned from the “To Do” state until the exact second that it last time it transitioned into the “Done” state. Anything that happened in between, including multiple moves to/from the “To Do” and “Done” states will be ignored. Issues that are not completed are completely ignored - only issues that are in “Done” will be counted. Weekends are ignored for the purposes of lead time calculations - if the period between when an issue was started and finished crosses a weekend, or multiple weekends, the entire 48 hour period of Saturday and Sunday is subtracted from the lead time.
How is WIP calculated?
WIP is calculated as of 23:59 (in your local time, as per the Jira timezone setting) of every day. That is, if you started an issue at 9AM and finished it at 5PM it will not show up as WIP because it was not in WIP at 23:59. This way WIP is only calculated for work that is carrying over from one day to the next rather than during at any point in the day when the figure will probably vary a lot.
Tips to get the most out of it
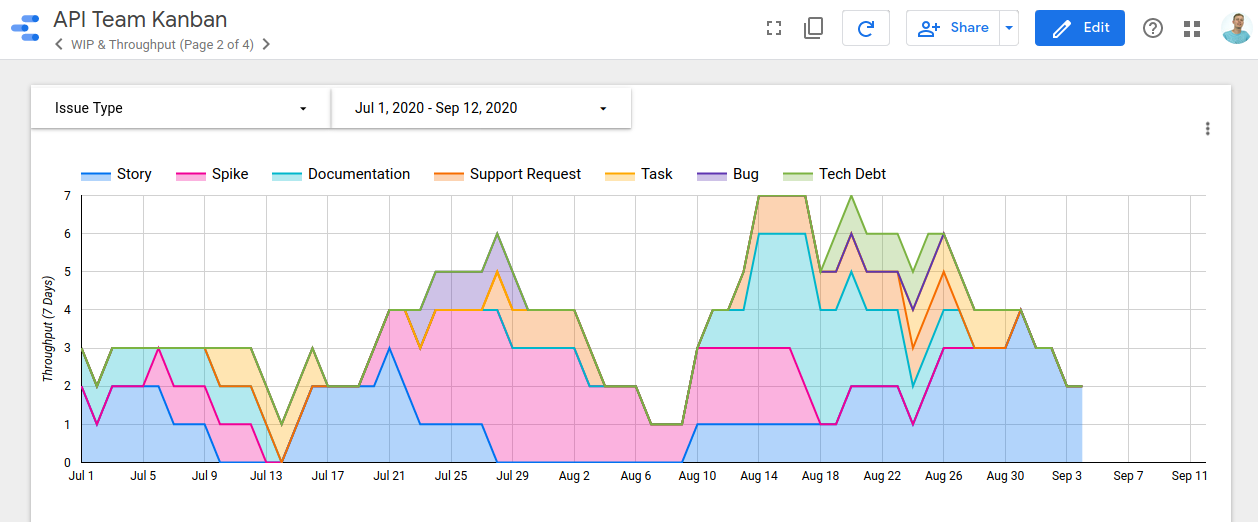
- Strictly separate your issues into different “Issue Types” in Jira. Group similar types of work together (e.g. Stories, Spikes, Documentation work, Support requests) to ensure that the insights for a particular type of work can be seen. For example, you may notice that your throughput for support requests went way up at a certain point but at the cost of your story throughput going down. If you do not have separate issue types for the two you would just see a flat throughput and may not notice that kind of thing.
- If certain issues are skewing your stats in a way that is making the stats hard to use, you can add a label to said issues in Jira and the filter out issues that have that label using your JQL query.
- To get a lead time histogram you may want to use the third-party visualization called “Histogram” as there is no native chart of this type. You can also use a workaround to get a histogram by creating a bar chart and using
CASEstatements to group your values into buckets.
Security
I’ve tried to proactively address some security concerns you may have.
Why does the connector need an additional hop between Jira’s API to your own API?
This additional hop is required in order to greatly speed up the rate at which records are tabulated and returned. Google App Scripts (the connector code itself) runs on limited processing power and does not have any way to store state (e.g. cache results). Suppose you have 2000 issues in Jira returned by your JQL query - this would require 20 Jira API requests (Jira paginates results by 100 issues) for every single chart or table in your report (Data Studio issues a new data request for each control). Running a report that has 10 charts would not only end up flooding Jira’s API with 200 requests every time but also it would be so slow that the report would be unusable.
Where are my Jira credentials stored?
Credentials are stored as properties on your own Google account - this is the only place they are persisted. When a request is made to the connector’s API (the intermediary layer between the connector and Jira itself) the credentials are passed along in an HTTPS request but not stored anywhere. When the results from Jira are tallied and processed, the results (which contain only things like the issue key, the lead time, and start/finish date - nothing sensitive) are persisted in a cache that gets cleared every day. The cache uses an SHA256 hash of your credentials and some other meta data as the key so finding the appropriate cache item for your request does not require persisting your credentials in any direct way.
What are my Jira credentials used for?
Only to do issue searches and confirm if the credentials are valid. No data will ever be modified in your Jira board.